The real cost of living in retirement: Retirement Affordability Index
By
Kaye Fallick
- Replies 0
Kaye Fallick is a best-selling author and the founder of YourLifeChoices website. She is a passionate advocate for those over 60. Learn more about her work on her website: Staying Connected.
There are many misleading indications of what you supposedly ‘need’ to have saved to enjoy a good retirement.
The most damaging projections suggest that $1 million or more is the required amount. Others are slightly more restrained, suggesting you will need $690,000 as a couple, $595,000 if single. But these amounts are still way above the real life savings of people on the verge of retirement. Those aged 65-69 hold median super account balances of $417,000 for a couple, $218,000 if a single male and $199,000 if a single female.
How are everyday retirees meant to reconcile these numbers? Where can you turn for more realistic spending measures based upon actual retiree behaviours?
The good news is that help is at hand. Eight years ago I shared this challenge with Matt Grudnoff, senior economist at The Australia Institute and we discussed the need for more useful spending targets, ones that included the many retirees who are renting.
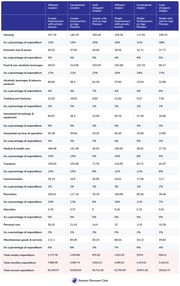
We created six ‘tribes’ to represent different types of retirement and named them according to their relative financial freedom. The following table explains the tribes and their attributes.
| Retirement tribe | Retirement income | Living situation | % of retirees |
| Affluent couples: | Receive the majority of their income from private sources | Homeowners | 18% |
| Affluent singles: | Receive the majority of their income from private sources | Homeowners | 11% |
| Constrained couples: | Receive the majority of their income from government pensions and allowances | Homeowners | 23% |
| Constrained singles: | Receive the majority of their income from government pensions and allowances | Homeowners | 29% |
| Cash strapped couples: | Receive the majority of their income from government pensions and allowances | Renters | 4% |
| Cash strapped singles: | Receive the majority of their income from government pensions and allowances | Renters | 14% |
| Other | Receive the majority of their income from private sources | Renters | 1% |
Matt then worked his magic by applying expenditure for these different cohorts, as provided to us by the Australian Bureau of Statistics (ABS). This allowed him to chart the spending of each different group of retirees, and to measure changes to this expenditure as prices for different goods and services rose and fell across successive CPI reporting periods.
Matt updates this table every quarter, so here is the most recent Retirement Affordability Index, adjusted for CPI changes to 30 June 2025.

If you would like to compare your own spending with these benchmarks, you can click here for a live table which enables you to put in your own household costs for each category and find out if you are spending above or below the standard for your tribe.
One of the major points of difference between the Retirement Affordability Index and the ASFA Retirement Standard are the costs quoted for renters. The ASFA table suggests that single renters spend $46,663 per year and couple households who rent spend $64,259. But we are aware many renters are on a full Age Pension, which, even with the 20 September increases factored in, amounts to just $30,649 (singles) or $46,202 (couples) per annum. So how can a single renter on a full Age Pension alone, actually cover ASFA’s suggested $46,000 in outgoings? This is the gap that remains unexplained.
I hope these benchmarks are useful. Some retirees will be spending less and are to be congratulated on managing sustainable spending. It’s possible, however, that you are spending more. That’s fixable. The first step to successful budgeting is to start where you are, by knowing how much you actually spend. This you can do by inputting your spending into the table. You can then see how much above your tribe you are spending. If you have enough income and are happy with your current lifestyle, then there’s probably no issue.
But if you feel that you would like to spend less, you can then examine on a category by category basis where the overspending is occurring. If it’s on essentials, then it may be time to negotiate a better deal or change provider. If it’s on discretionary spending then it’s time to scrutinise the treats you value highly – and those you are prepared to go without. You’re in the driver’s seat and with the knowledge gained from the Retirement Affordability Index, you can make your own best decisions.
What’s changed since end March?
Here's Matt’s summary of the movements in prices over the last quarter:
Inflation rates for our tribes have fallen again. For many tribes’ inflation is now below 2%. The only two tribes above 2% are cash-strapped couples and cash-strapped singles, both of whom are at 2.1%.
The biggest drivers of inflation over the last year were healthcare, food, and housing, while transport continued to help push average prices down.
Annual healthcare costs rose by 4.1%. The quarterly increase was driven by the annual increase in private health insurance premiums. This had a bigger impact on affluent and constrained tribes because they are more likely to have private health insurance.
Annual food inflation was steady but remains higher than many other categories at 3%. This affected poorer tribes more because they spend a larger proportion of their income on essentials such as food.
Annual housing inflation was just 2%, with falling electricity prices (due to the Federal Government rebate) the main contributor to this low result. But the annual rise in rents was the biggest contributor to inflation. This significantly affected cash-strapped tribes as the only tribes that rent.
Transport was the biggest factor helping to bring average prices down. Over the last year transport costs have fallen 2.6%, driven mainly by automotive fuels, which have fallen 10%. The biggest beneficiaries of this drop are affluent and constrained tribes as they tend to travel more than cash-strapped tribes.
Inflation now appears to be back at normal levels and well and truly in the RBA’s ‘target band’ of 2% to 3%. For many retired tribes it is now below the target band. We saw another interest rate cut in August which will be a welcome relief for those with a mortgage but will negatively affect those with funds earning interest in the bank. These are far more likely to be retired people.
The market is expecting more interest rate cuts, including one more this year (most likely in November). But it is important to remember that no one really knows for sure where interest rates will be in the future. There is still a lot of uncertainty, mainly stemming from the United States. President Trump’s policies, particularly around tariffs, might push up inflation and interest rates in the US. Tariffs won’t push up prices in Australia, but economic chaos leading to a US recession will have unpredictable impacts on the world economy and Australia.
Notes and definitions
Retired: A household aged 55+ in which no one is working or looking for work. While the vast majority are 65 or over, a small proportion are aged 55 to 64. (14% of retired households were aged 55 to 64)
Housing tenure: Split into owners and renters. Owners include people with and without a mortgage.
Income: The two income groups are those that get the majority of their income from government pensions and allowances and those that get the majority of their income from private sources. Private sources include superannuation, but also other assets held outside of super. This means that the affluent tribes might be on a part pension, but if so, their private income (from investments) is greater than their income from government payments. It also means that constrained and cash strapped tribes might be on a part pension, but most of their income comes from government sources.